NACS Convenience Trends
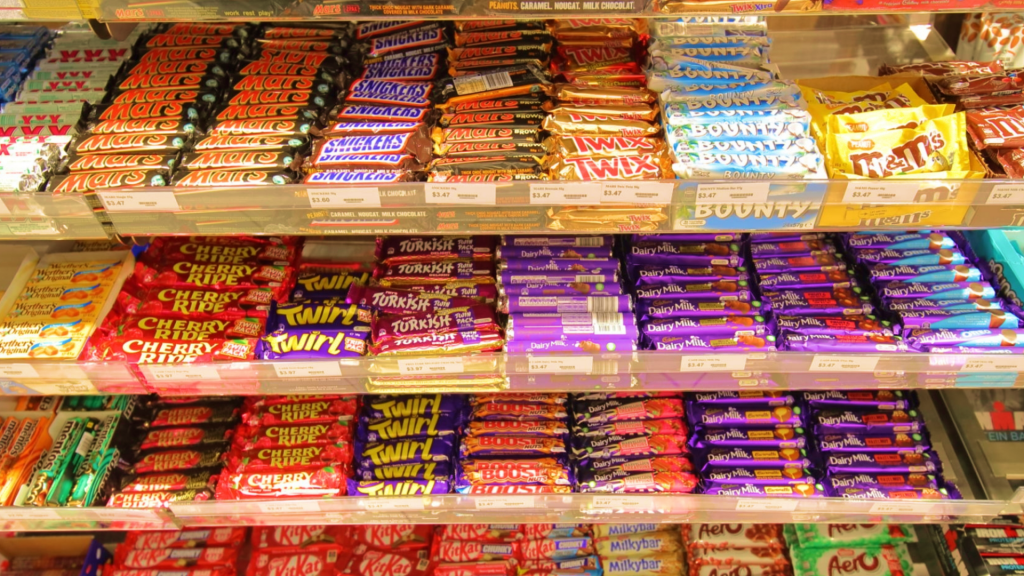
The NACS 2021 SOI survey revealed that candy, for 2020, accounted for about 3% of c-store sales. Here are a few more facts about candy that you should know about.
According to NACS 2021 SOI report:
- 2.9% of inside store sales were attributed to candy
- 43.9% of candy sales were chocolate bars
- Candy is an impulse item
Although candy is not a large portion of sales, c-stores are the second most popular channel for sales after grocery stores, according to the National Confectioners Association (NCA), the organization that puts on the Sweets and Snacks Expo.
A few of their reports help us to dive deeper into trends. These are just a few stats from their 2019 Getting to Know Chocolate Consumers Report:
Candy Trends (Grocery, Drug Store, Convenience and Other)
The number 2 destination for chocolate purchases is convenience stores. Who buys from convenience stores?
- Younger Millennials 60%*
- Older Millennials 54%
- Gen X 54%
- Baby Boomers 32%
Sweet Insights: NCA State of Treating 2021 Report indicates:
The NCA’s 2021 report shows that, although Grocery sold more chocolates, c-store sold the most in term of gum and mints.
Grocery:
- $7.1 Billion in candy
- $4.6 Billion in chocolate
- $1.8 Billion non-chocolate
- $740 Million in gum and mints
Convenience:
- $6.0 Billion in candy
- $2.9 Billion chocolate
- $2.2 Billion in non-chocolate
$957 Million in gum and mints
*NCA Definitions (2020)
- Young Millennials: ages 23 to 28
- Older Millennials: ages 29 to 38
- Generation X: ages 39 to 54
- Young Baby Boomers: ages 55-62
- Older Baby Boomers: ages 63-72
References: https://candyusa.com/wordpress/wp-content/uploads/2020/05/Getting_to_Know_Chocolate_Consumers_FINAL_for_website_store.pdf
https://candyusa.com/wordpress/wp-content/uploads/2021/03/2021_State-Of-Treating_Bite-Sized-Taste.pdf


