Estimated reading time: 6 minutes
As owner/operators of 30 stores, we know the most vital component to running a successful convenience store is data.
Why? Because accurate and accessible data is required to make informed business decisions that save time, reduce shrink, maintain regulatory compliance, and increase profit margins.
Back-office software can help. For example, CStoreOffice captures your store data to automatically generate over 200 available reports. With these reports, convenience store and gas station owners can leverage the data to gain insight into their daily operations. Ultimately, increasing profit.
So how is this done? We’ve compiled a list of CStoreOffice user’s top 8 reports – and how to use them.

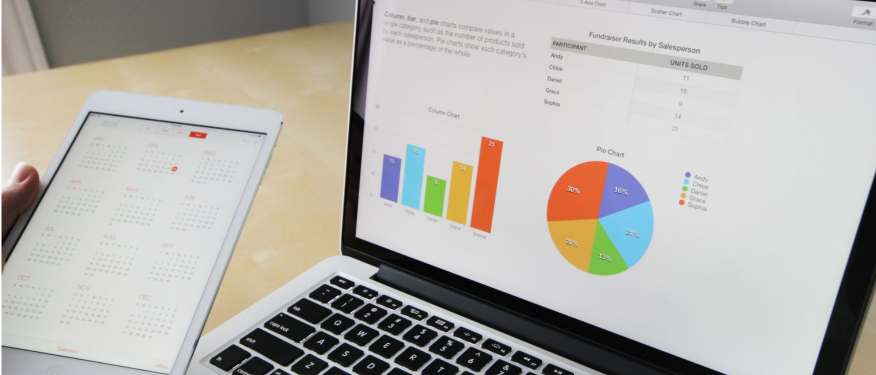
We’ll begin with the most popular category: sales reports. Broadly, sales reports offer specific data on how inventory is selling. In turn, this helps them understand appropriate inventory quantities and when to order to avoid overages and insufficiencies.
Sales reports also give insight into whether items don’t sell or sell out quickly, which may indicate that they are priced too high or too low. Users can then adjust item prices to increase sales – and the bottom line. They can be filtered into a variety of groups and help owners understand what items sell the best at their stores.
Sales Reports
1. Category Sales
The National Association of Convenience Stores (NACS) determines categories of goods commonly sold by c-stores. These include groupings such as frozen foods, salty snacks, beer, and cigarettes. In December of 2021, the NACS updated the categories to reflect changes in consumer’s shopping habits since the onset of the COVID-19 pandemic and to include newer products. The Category Sales report allows users to view sales by over 200 pre-set categories of goods commonly sold by c-stores. For example, the new categories include alcoholic seltzers and renewable diesel fuel.
2. Item Sales by Tags
Want to categorize your inventory beyond the pre-set categories from the NACS? CStoreOffice allows you to create custom tags that can be tailored to your business needs. Such as, items tagged by store, price zone, or physical location. This enables you to have more control over the way you interact with other reports.
Because ales can be reported by these custom tags. The report accounts for individual item cost and price to give you more insight into your true profit. With this report, you can make better inventory purchasing and price book decisions – ultimately improving your bottom line.
3. Department Sales
The Department Sales Report shows item sales by department. Departments are used for categorizing items within a point-of-sale (POS) system to ensure goods are taxed at the appropriate rate.
Sometimes two departments may exist in the same category. Such as non-taxable and taxable grocery departments may both be found under the grocery category. For instance, in Pennsylvania fruit drinks containing less than 25% real fruit juice are subject to state sales tax, while fruit drinks containing more than 25% real fruit juice are not subject to state sales tax.

Fuel Reports
4. Statistical Inventory Reconciliation (SIR) Reports
For fuel retailers, regulatory reports are required by the Environmental Protection Agency (EPA). These regulations mandate that business owners keep detailed records of fuel delivered and sold to ensure that no fuel leaks are occurring underground.
After entering daily tank gauge readings into CStoreOffice, it automatically calculates any fuel overages or shortages in the SIR Reports. Then, the system will alert you if there is an error over a certain threshold that needs to be investigated*, saving time while staying compliant.
*Note: SIR reports generated from CStoreOffice are dependent on user-entered data and rely on accurate data entry to successfully detect leaks.
Inventory Reports
5. Item Shortage Report
An item shortage report enables you to identify inventory shortages and overages. The report also includes data on the sales, shrink percentage, and cost of the item. This information can be used to confirm if a store has the correct quantity of items.
For example, if a retailer purchases 10 bags of potato chips and sells five to customers, but only three are counted in an inventory count, then the Item Shortage Report will indicate the shortage of two bags.
If there is a discrepancy, inventory may have been stolen or damaged. Item shortage reports give c-store owners more data on what items may commonly be stolen or go bad before they can be sold. In turn, informing purchasing, security decisions, and helping to reduce shrink.

6. Itemized Inventory
The Itemized Inventory report gives a list of how many of each item a store carries that they have on hand after a full-store inventory or cycle count. The report can be filtered by category, department, or tags.
With this information, store operators can assess commonly out-of-stock items to ensure they properly maintain the supply chain. In turn, this helps retain more customers, as 31% of consumers will buy an item at another store if it is out-of-stock at the store of their choice.
Other Reports
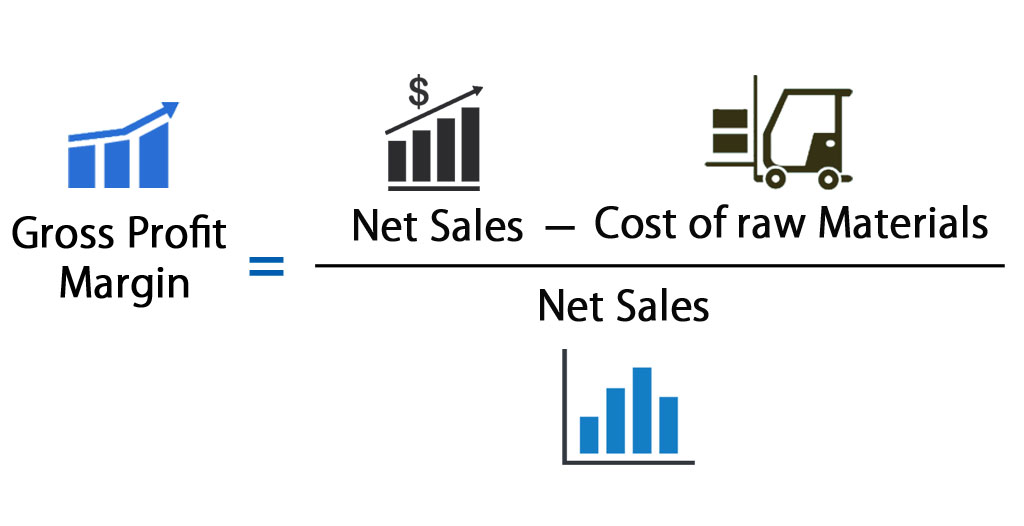
7. Gross Profit Margin (GPM) Report
GPM is calculated by subtracting the cost of goods sold (COGS) from revenue and dividing the difference by total revenue. GPM is frequently expressed as a percentage of sales, and this report will calculate the percentage automatically.
In this report, users can select the parameters by which their GPM is defined. For example, reports can be generated by location, department, or category. Within the same location, GPM reports can be generated by time periods, item tag, or manager.
With these insights into specific GPMs groups, convenience store operators can make informed decisions to improve profit margins. For instance, prices may need to be increased on an item that has a lower GPM or decreased on an item that has a higher GPM but isn’t being purchased by customers due to price.
8. Expenses Report
The Expenses report provides detailed records of operational expenses for each location. Expenses can include services, such as snow removal, utilities, and royalty fees. The report includes the name of the payee, the kind of expense, the amount paid, and the method of payment. CStoreOffice also integrates with QuickBooks to further simplify your accounting processes.
With the expenses report, store owners or managers have a centralized place to ensure their expenses are paid and maintain a digital audit trail.